 The RMarkdown output of a section from the data analysis
Why create this project?
The outcome of last year’s presidential election was a big surprise to many of us. Even on the day of the election Clinton was estimated to have a winning chance of 71.4% compared to 28.6% for Trump by Nate Silver.
We will use two datasets: aug_poll.Rdata and 2016_election_result.csv in this project. aug_poll.Rdata contains poll data collected from polls that closed between Aug. 1, 2016 and Oct. 27, 2016. This dataset was originally posted on fivethirtyeight.com.
In this project we will study the patterns of the errors in presidential election polling data. We would like to answer these questions: • Do the errors seem random, and specifically are they distributed symmetrically around zero? • Among the states with CI (confidence interval) estimates that are away from zero (i.e., among the states that we were confident about whom the winning candidate the state would be), how many of their CIs predicted the correct state winner?
How was the analysis performed?
In Section 1, we are simply loading poll data into R and adding new columns of data to our dataset in R. We wanted to transform the dataset by showing proportions of votes in a state rather than showing the raw number of voted.
Section 3 added more columns of data based on the raw polling results. We added std.unit which is the number of standard error units each poll result is from the actual election results. Just as importantly, we added the significant column (a vector that shows TRUE if the 95% CI for estimating the proportion of Trump supporters - proportion of Clinton supporters does not cover 0 which would imply no difference between polling and actual results for both candidates).
We then plotted the standard error data to view any states that may have overestimated Clinton or Trump votes during polling season. Tests were run on states with abnormal error differences indicating a fundamentally wrong prediction during polls that cannot be explained by random change.
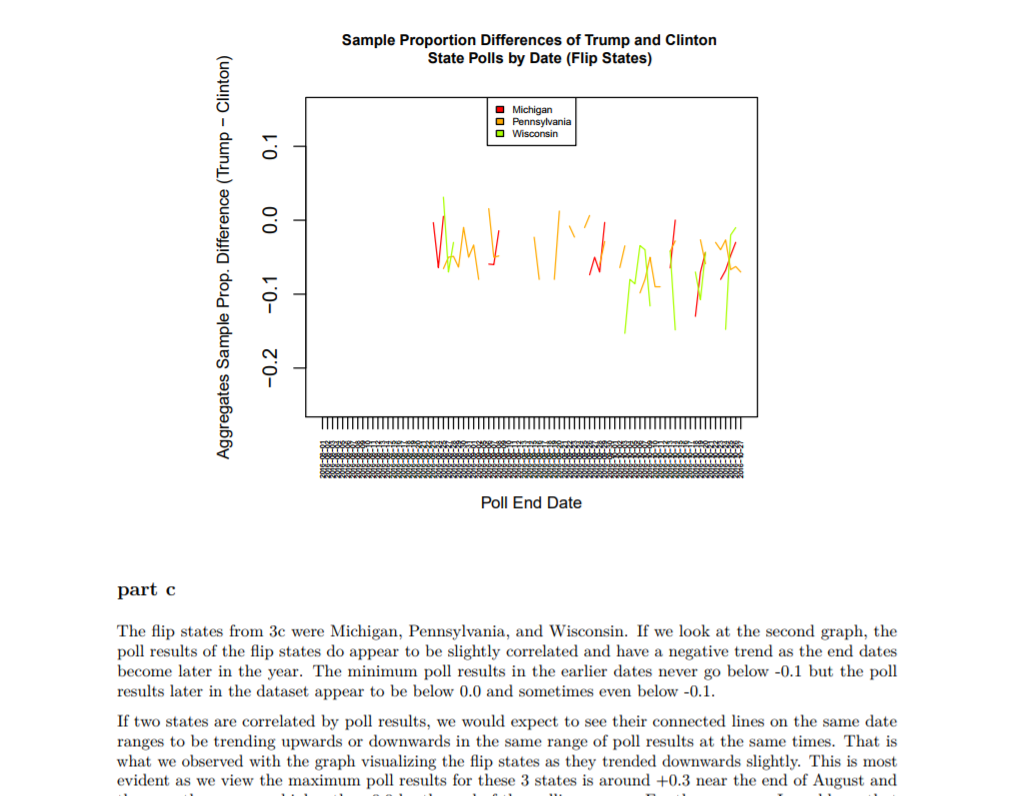
Section 4 splits the dataset into narrower definitions of swing states and flip states (the states from Section 3 that had incorrect predictions). These states were plotted and we looked for states that were both flip states and swing states.
All graphs were created using native R solutions. The final results indicate that many of the flip states with incorrect predictions were states that predicted a strong performance from Clinton.
Miscellaneous information
The analysis was originally created in a RMarkdown file. However, Github does not render RMarkdown files nicely. Thus, the file was converted to an ordinary R file with a littany of comments.
To view the RMarkdown output of the file please visit this link.
If there are any questions feel free to contact me through Email. All code for the project can be found here.